You are viewing documentation for Kubernetes version: v1.24
Kubernetes v1.24 documentation is no longer actively maintained. The version you are currently viewing is a static snapshot. For up-to-date information, see the latest version.
Dashboard - Full Featured Web Interface for Kubernetes
Editor’s note: this post is part of a series of in-depth articles on what's new in Kubernetes 1.3
Kubernetes Dashboard is a project that aims to bring a general purpose monitoring and operational web interface to the Kubernetes world. Three months ago we released the first production ready version, and since then the dashboard has made massive improvements. In a single UI, you’re able to perform majority of possible interactions with your Kubernetes clusters without ever leaving your browser. This blog post breaks down new features introduced in the latest release and outlines the roadmap for the future.
Full-Featured Dashboard
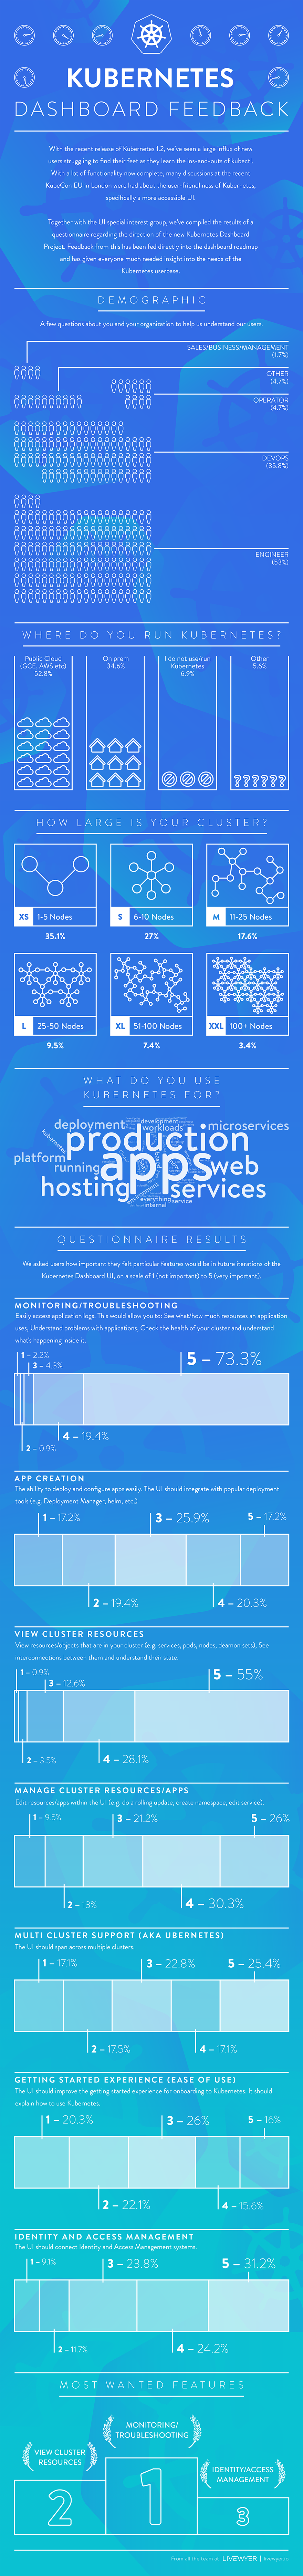
Thanks to a large number of contributions from the community and project members, we were able to deliver many new features for Kubernetes 1.3 release. We have been carefully listening to all the great feedback we have received from our users (see the summary infographics) and addressed the highest priority requests and pain points.
The Dashboard UI now handles all workload resources. This means that no matter what workload type you run, it is visible in the web interface and you can do operational changes on it. For example, you can modify your stateful MySQL installation with Pet Sets, do a rolling update of your web server with Deployments or install cluster monitoring with DaemonSets.

In addition to viewing resources, you can create, edit, update, and delete them. This feature enables many use cases. For example, you can kill a failed Pod, do a rolling update on a Deployment, or just organize your resources. You can also export and import YAML configuration files of your cloud apps and store them in a version control system.

The release includes a beta view of cluster nodes for administration and operational use cases. The UI lists all nodes in the cluster to allow for overview analysis and quick screening for problematic nodes. The details view shows all information about the node and links to pods running on it.

There are also many smaller scope new features that the we shipped with the release, namely: support for namespaced resources, internationalization, performance improvements, and many bug fixes (find out more in the release notes). All these improvements result in a better and simpler user experience of the product.
Future Work
The team has ambitious plans for the future spanning across multiple use cases. We are also open to all feature requests, which you can post on our issue tracker.
Here is a list of our focus areas for the following months:
- Handle more Kubernetes resources - To show all resources that a cluster user may potentially interact with. Once done, Dashboard can act as a complete replacement for CLI.
- Monitoring and troubleshooting - To add resource usage statistics/graphs to the objects shown in Dashboard. This focus area will allow for actionable debugging and troubleshooting of cloud applications.
- Security, auth and logging in - Make Dashboard accessible from networks external to a Cluster and work with custom authentication systems.
Connect With Us
We would love to talk with you and hear your feedback!
- Email us at the SIG-UI mailing list
- Chat with us on the Kubernetes Slack #SIG-UI channel
- Join our meetings: 4PM CEST. See the SIG-UI calendar for details.
-- Piotr Bryk, Software Engineer, Google